NonPoint - Modeling software for: Carpenter, S.R., W.A. Brock, and P.C. Hanson. 1999. Ecological and Social Dynamics in Simple Models of Ecosystem Management. Conservation Ecology.
Chapter 6 – Land Manager
Land Manager differs from the other two models in that soil phosphorus, dictated by the proportion of farmers who choose phosphorus intensive farming (P-intensive) over phosphorus conservative practices (P-conservative), contributes to the phosphorus dynamics in the ecosystem. Regulators set farming policy based on the phosphorus threshold set by you the game player. Farmers decide between P-intensive and P-conservative practices by predicting future profitability based on their own individual models of the probable future behavior of the regulator.
Players
Scientist: The scientist (Monitoring, Assessment and Forecasting Component of Carpenter et al. 1999) measures the phosphorus load to the system and the current water phosphorus levels, and makes these data available to you the game player.
You the game player: You work closely with the regulator by controlling the Phosphorus Threshold, which is the permissible lake phosphorus level.
Regulator: The regulator uses the phosphorus threshold to develop policies that regulate p-intensive farming and produce incentives for p-conservative farming.
Farmers: Farmers select their farming practices based on previous experience, the large-scale market for farm products, and their predictions of future regulations or incentives. Their choices are based on expected returns from P-intensive versus P-conservative practices (Appendix 4 of Carpenter et al. 1999).
Ecosystem: Phosphorus accumulates in the soil as a function of farming methods and random load disturbances (Appendix 7 of Carpenter et al. 1999). NonPoint calculates phosphorus load to the lake as a function of farmer methods, soil phosphorus, and random load disturbances. Once the phosphorus load enters the lake, the lake responds with its intrinsic phosphorus cycling mechanisms (Appendix 1 of Carpenter et al. 1999).
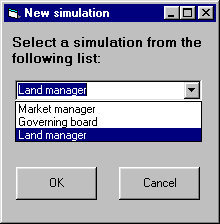
Creating a New Simulation
To create a simulation, simply follow these four steps.
Simulation Specific Controls
In this simulation, your role in setting the phosphorus threshold allows you to influence the regulator's policies. Changes you make to the slide bars are immediately implemented as you release the mouse button.
Phosphorus Threshold: The phosphorus threshold is the permissible lake phosphorus level. You can adjust the threshold by moving the slide bar over its range of 0.01 to 2.0. When the Mark box is checked, changes you make to the slide bar show as white triangles in the graphs at the following x,y coordinates: x = year, y = proportion of maximum possible phosphorus threshold. You can adjust the slide bar at any time during the simulation.
Output Graphs
All output graphs run synchronously, with years being the x axis unit. All line data are plotted on the left y axis. The white and red marks are plotted on the right y axis, with the scale, ranging from zero to one, representing the proportion of maximum for the given simulation specific control.
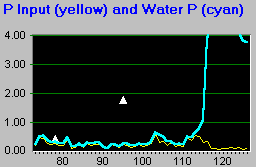
Graph 1: Target Phosphorus and Actual Phosphorus Loads
The phosphorus threshold that you set helps the regulator determine farming policy. Farmers respond by choosing p-intensive or p-conservative practices, which in turn determine the phosphorus output to the ecosystem. The white triangle indicates that the user increased the phosphorus threshold from about 0.2, which was set on year 78, to about 0.9 on year 95. Fifteen years later, lake phosphorus levels shot off the chart.
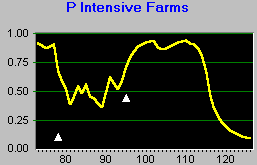
Graph 2: Phosphorus Intensive Farms
On year 95, the user increased the phosphorus threshold to about 0.9. P-intensive farming peaked five years later and sustained until the lake turned eutrophic. At about year 115 the regulators stiffened p-intensive regulations and improved p-conservative incentives, which resulted in a sharp decline of p-intensive farming.
Graph 3: Total Economic Output
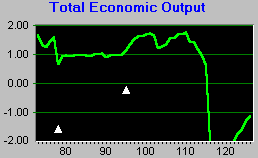
Raising the phosphorus threshold increased the total economic output of the system, which includes farming and lake related revenues. As the lake crashes on about year 115, everyone loses money and they are still trying to break even ten years later.
Graph 4: Profit Foregone
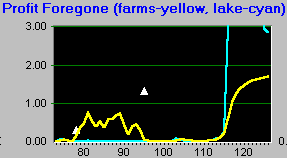
Relatively low phosphorus thresholds hurt farmers from year 76 to year 95. By increasing the threshold on year 95, the user allows the regulator to relax policy, and the farmers benefit without apparent economic penalty to those who make money from the lake. Once again, everyone loses profits on year 115 when the lake turns eutrophic and p-intensive regulations are tightened.
Graph 5: Performance Measures
NonPoint measures your performance by calculating the percentage of days when lake phosphorus was less than one, and by calculating the mean economic output of the system (values adjusted to match the scale). These measures help you to determine relative performance between simulations.
Graph 6: Phosphorus Conservative and Phosphorus Intensive Farms
NonPoint displays the overall mean percentages of P-intensive and P-conservative farmers. Through day 125 of this 300 day simulation, the phosphorus intensive farmers have dominated the scene.